The Dutch WEEE Flows 2020: What happened between 2010 and 2018?
“The Dutch WEEE Flows 2020: What happened between 2010 and 2018?” quantifies the 2018 Dutch WEEE Flows in 2018 manner comparable to the Dutch WEEE Flows study of 2010. This report presents the EEE POM, WEEE Generated, the compliantly regulated WEEE Collection, and the WEEE Flows outside of the regulated WEEE management system in the Netherlands.
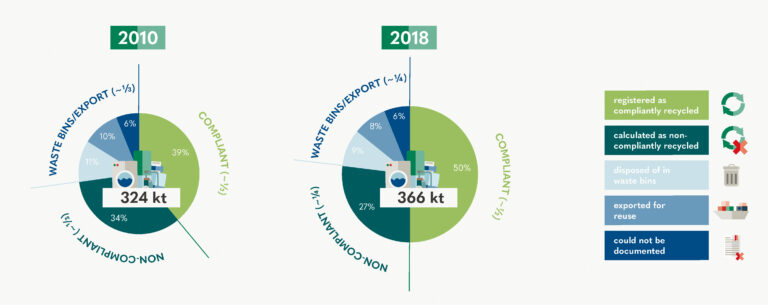
The main findings of the report are that WEEE Generated increased from 324 kt in 2010 to 366 kt in 2018. In 2018, half of the WEEE Generated which was compliantly recycled. Approximately one quarter is calculated to be non-compliantly recycled, and another quarter was disposed of in waste bins or exported for reuse, or could not be documented. In 2010, approximately one third was compliantly recycled, one third was non-compliantly recycled, and another third was disposed of in waste bins, exported for reuse, or could not be documented. The study provides a set of recommendations to improve the reporting and collection of WEEE.
WEEE Generated and WEEE Flows in 2010 and 2018
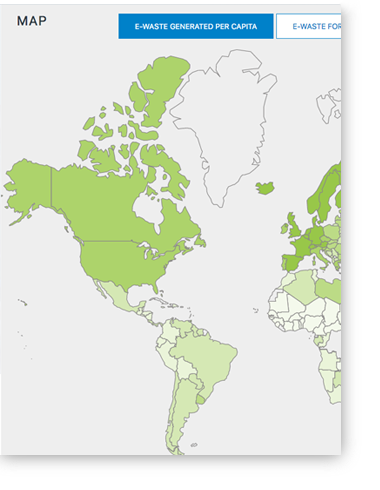
Other E-waste Data Resources
Regional E-waste Monitor for the Arab States 2021
• Regional E-waste Monitor for the Arab States 2021
Regional E-waste Monitor CIS + GEORGIA 2021
• The Regional E-waste Monitor CIS+GEORGIA 2021
Regional E-waste Monitor Asia 2016
• Regional E-waste Monitor 2016: East and Southeast Asia
